
Air Quality Planning Technical Analysis and Data
Overview
This page houses information related to the RAQC’s work around air quality data, modeling, and technical analysis to support air quality planning. Tracking and modeling ozone concentrations are essential to ensure that air quality planning decisions are backed by science and to estimate and monitor progress towards air quality goals.
Ozone Tracking: Monitoring Progress Towards Attaining Ozone Standards
The RAQC utilizes data from several ozone monitors around the Denver Metro/North Front Range region to track when and where ozone concentrations fall under or exceed air quality standards and goals. Ozone summary tables are updated weekly during Ozone season, which runs from approximately May to September. The most recent summary table can be found here. Historic summary tables are available here. While this information is intended for longer-term tracking and analysis relevant for State Implementation Plans for ozone and overarching air quality planning, the RAQC also provides daily ozone air quality alerts and advisories through its Simple Steps. Better Air. program.
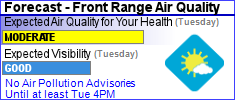
The Colorado Department of Public Health and Environment’s Air Pollution Control Division (APCD) also provides air quality data and information to the public. These include Denver/Front Range air quality forecasts, a Colorado Smoke Blog, maps, daily ozone email alerts, and more.
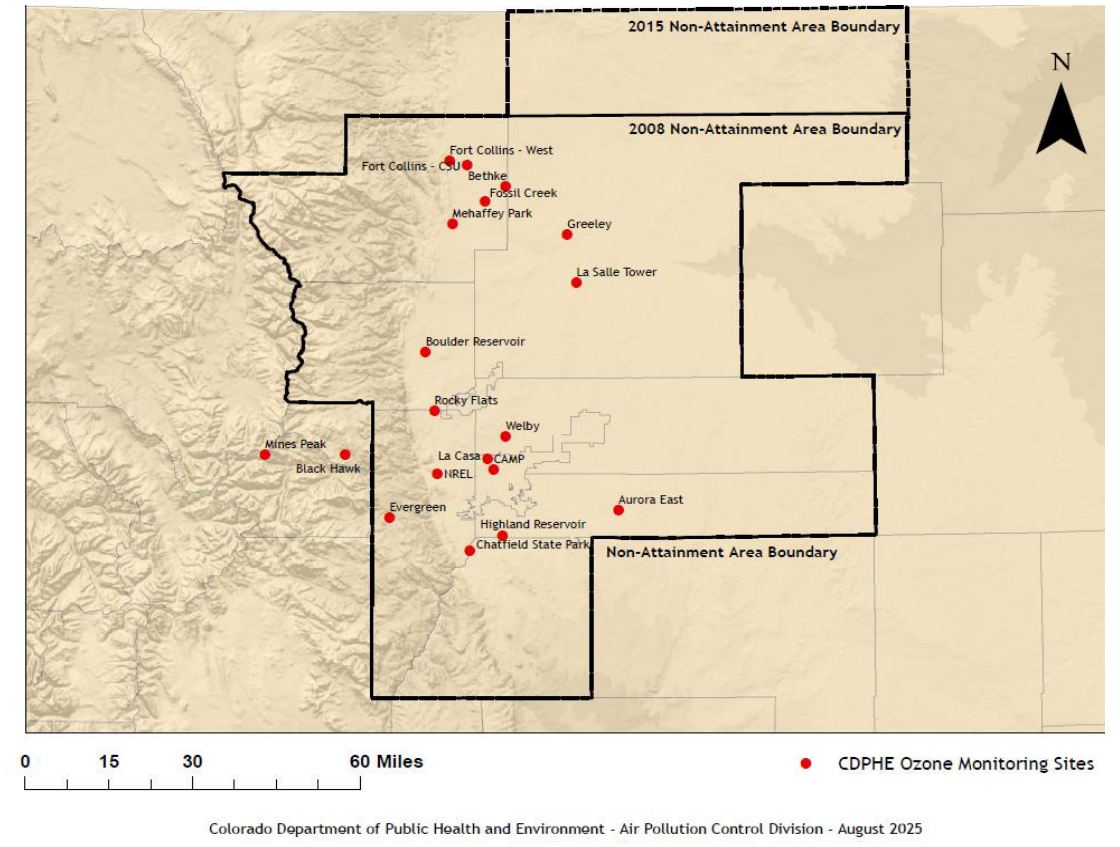
A map of the locations of air quality monitors in and near Colorado’s Ozone Nonattainment area for the two federal Ozone Standards, which is indicated by the black outlines.
Emissions Analyses and Ozone Modeling: Verifying that Future Emissions Will Fall Below Ozone Standards
To aid in evaluating the impact of emissions control strategies as well as developing Attainment Demonstrations as part of SIP requirements for U.S. EPA, the RAQC also engages in air pollution modeling efforts called photochemical modeling in collaboration with the APCD. The RAQC’s emissions and ozone air quality modeling efforts include reports and dashboards related to current and past SIP planning processes as well as information from its Attainment Planning forum meetings, which provide an opportunity for stakeholders and the public to engage.
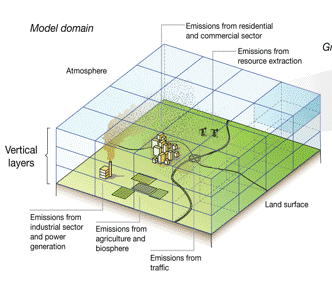
An overview of the structure of and selected inputs to a photochemical air quality model required by EPA for attainment planning. It takes into account the 3D effects of emissions on air quality in a region. From AWMA Environmental Manager magazine, July 2012 issue: Douw Steyn, Peter Builtjes, Martin Schaap, Greg Yarwood.
RAQC-Led Air Quality Enterprise Projects
The Colorado Air Quality Enterprise Board selected the RAQC to receive funding for following projects, under the second round of funding of the AQE’s Ozone Related Research Request for Proposal:
Project Title: Front Range OZone Experiment (FROZÉ): NOx and VOC Observations and Analysis in the Denver Metro/North Front Range Ozone Nonattainment Area to Support the State Implementation Plan
- Awardee: Regional Air Quality Council/Colorado State University/APCD Technical Services Program
- Awarded Amount: $1,375,000
- Executive Summary from original May 2024 proposal as posted by the AQE
- Updated Project Executive Summary prepared by RAQC-CSU-APCD team – July 2025
Project Title: 2020-2024 Wildfire Ozone Impacts
- Awardee: Regional Air Quality Council/Ramboll Americas Engineering Solutions, Inc./Air Sciences Inc.
- Awarded Amount: $140,000
- Executive Summary from original May 2024 proposal as posted by the AQE
- Smoke IMpact Assessment System (SIMAS) version 1 report – December 2024 (SIMAS will be updated and improved to version 2 in the AQE project.)
- Smoke IMpact Assessment System (SIMAS) version 2 report – March2026
RAQC-proposed Air Quality Enterprise Projects
RAQC has submitted or is involved in these proposals to the Colorado Air Quality Enterprise Board to receive funding under the AQE’s Request for Proposal 2025000002, Advancing Air Quality in Colorado through New and Emerging Technologies:
- Proposed by RAQC: “RECEP” – The Robust Emissions Control Evaluation Program for Developing Air Pollution Mitigation Strategies in Colorado
- Proposed by RAQC-Ramboll-University of Wisconsin: Robust, Multifaceted, and Satellite-Informed Evaluation of Lateral Boundary Conditions to Support Photochemical Grid Modeling Improvements for Evaluating Air Pollution Mitigation Strategies in Colorado
- Proposed by Georgia Tech Research Corporation with RAQC involvement: Quantifying Sector-Specific Emissions Impacts and Assessing the Efficacy of Air Quality Regulations in Colorado using Temporally Resolved Observations and Advanced Modeling